Curtailment by ISO
SPPSouthwest Power Pool
Jul 28, 2026Solar curtailed
1.3 GWh
Wind curtailed
3.2 GWh
Solar · 30d34.5 GWh
Wind · 30d392.8 GWh
90-day trend
SolarWind
SPP · kardashev-data
CAISOCalifornia
Jul 27, 2026Solar curtailed
9.9 GWh
Wind curtailed
129 MWh
Solar · 30d226.3 GWh
Wind · 30d15.2 GWh
90-day trend
SolarWind
CAISO · kardashev-data
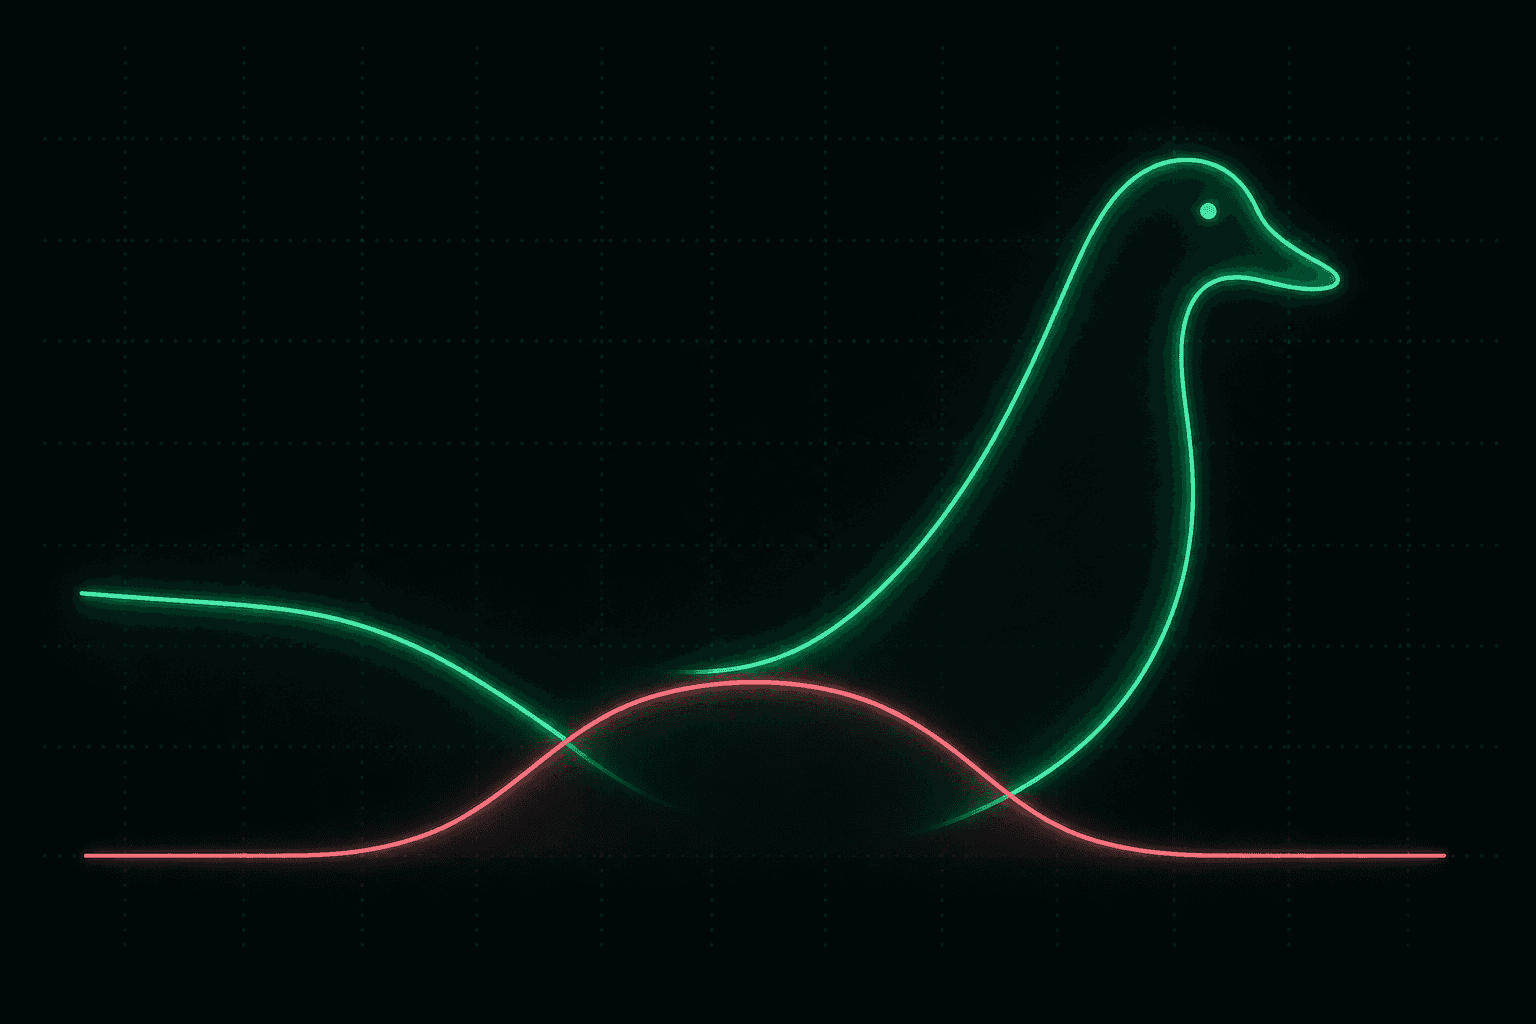
What is curtailment?
When the grid can't absorb all available solar and wind, operators instruct generators to produce less, even when the sun is shining. High curtailment signals congested transmission, insufficient storage, or poor demand timing.
CAISO leads in solar curtailment (the duck curve). SPP leads in wind curtailment across the Great Plains.